Biology
150 Cells & Genetics
November
29, 2012
Abstract:
The properties of
enzymes were testing using the enzyme peroxidase. To observe and quantify the
enzyme’s activity, guaiacol, a colorless dye that turns brown when oxidized was
mixed into the peroxidase solutions. Hydrogen peroxide was the substrate in
this experiment. The affects of enzyme quantity, temperature, pH, and boiling on
enzyme activity were all tested experimentally. The more enzyme there was in a
solution resulted in a linear increase in enzyme activity. The temperature and
pH tests resulted in bell curves; pH 5 and between 22° and 32° C were found to
be the optimum conditions for enzyme activity. Boiling ceased enzyme activity,
because of denaturation of the enzyme.
Introduction:
This
study was done to test the properties of enzymes. Despite the bounty of
research already available on enzymes, this test was conducted to test these
theories and hypotheses to make sure that this information is correct.
Much
study has been done on enzymes, and therefore there is much information that
already exists about them. Enzymes catalyze reactions by lowering the
activation energy required for specific reactions to take place. Enzymes can do
this in a variety of ways (1) conformation, they can create an optimum
environment by positioning substrates in necessary spatial orientation for
bonding; and (2) they provide a micro-environment of different pH. All
of these factors lower the
activation
energy required to catalyze a reaction between various substrates.
Enzymatic
activity is regulated by a number of mechanisms. Some factors that can affect
an enzyme’s activity include (1) pH, which can modify the position of positive
and negative charges, thereby influencing the enzyme’s ability to bind to a
substrate; and (2) temperature, which affects the rate of collisions between
the substrate and enzyme molecules, as well as substrate binding (Campbell et al., 2011).
In
the conducted experiments, the following hypotheses (which test enzyme activity
in different environmental conditions) were tested: a. the amount of enzyme
does not influence the rate of reaction, b. the temperature of a solution does
not influence enzyme activity, c. the pH of a solution does not affect the
activity of an enzyme, d. boiling an enzyme does not affect its activity, e.
molecules that are shaped similarly to an enzyme’s substrate have no affect on
the activity of the enzyme.
These
hypotheses were tested by using the enzyme peroxidase to catalyze the
conversion of hydrogen peroxide (H2O2) into water (H2O)
and oxygen (O2). Guaiacol is a dye that turns brown after it is
oxidized. The oxygen produced from the catalytic reaction will oxidize the dye
in the reaction mix converting the dye from a colorless state to a colored
state. Tests using this strategy are called dye-coupled reactions. To quantify thecolor of the final product, the accumulation of color,
indicating increasing formation of reaction product (oxidized guaiacol), can be
read in a spectrophotometer as increasing absorbance at 500 nm.
Materials
and Methods:
First, the
following null hypothesis was tested: the amount of enzyme added to the
reaction will have no affect on the rate of reaction. Seven test tubes were gathered
and labeled from 1 to 7. The exact quantities of each reagent specified in
Table 1, “Mixing table for first trial,” were added to each test tube. An
Eppendorf pipette and a 5mL pipette were used to deliver the buffer and H2O2
to the tubes; also, a 1mL pipette was used to transfer the guaiacol.
Table 1: Mixing table for first trial (quantities in mL)
|
Tube |
Buffer (pH 5) |
H2O2
|
Extract |
Guaiacol (dye) |
Total Volume |
|
|
control |
1 |
5.0 |
2.0 |
1.0 |
8.0 |
|
|
Set 1 |
2 |
2.0 |
1.0 |
3.0 |
||
|
3 |
4.5 |
0.5 |
5.0 |
|||
|
Set 2 |
4 |
2.0 |
1.0 |
3.0 |
||
|
5 |
4.0 |
1.0 |
5.0 |
|||
|
Set 3 |
6 |
2.0 |
1.0 |
3.0 |
||
|
7 |
3.0 |
2.0 |
5.0 |
Next, the
spectrophotometer 20 was calibrated. To do this, the wavelength was adjusted to
500 nanometers, and then, with no cuvette and the door shut, the meter reading
was adjusted to zero transmittance. The clear negative control sample was then
poured into a cuvette and inserted into the sample compartment, the cover was
closed and the meter was adjusted to read 100% transmittance (which is the same
as zero absorbance). Then the tube was removed and the lid closed; the meter
readout returned to zero.
After calibration,
tubes 2 and 3 were mixed by being poured back and forth twice within 10
seconds. Then the outside of the tube was wiped and the tube was inserted into
the spec 20 for an absorbance reading, and then subsequent absorbance readings
at 20 second intervals. This procedure was repeated for sets 2-3. Set 1 had the
most linear results, so 0.5 mL of enzyme extract was used for the rest of the
experiments.
Next, the affect
of temperature on enzymatic activity was tested by repeating the assay in waterbaths of varying temperatures: 4°, approximately 23°
(room temperature), 32°, and 48° C. Nine test tubes were numbered from 1 to 9
and then had the quantities of reagents listed in Table 2 added to them.
Table 2: Amounts of reagents added for temperature experiment
(volumes indicated in mL)
|
Temperature |
Tube |
Buffer (pH 5) |
H2O2
|
Peroxidase extract |
Guiacol (dye) |
Total Volume |
|
|
control |
1 |
5.0 |
2.0 |
0.0 |
1.0 |
8.0 |
|
|
4° C |
2 |
2.0 |
1.0 |
3.0 |
|||
|
3 |
4.5 |
0.5 |
5.0 |
||||
|
Room Temp = 22° C |
4 |
2.0 |
1.0 |
3.0 |
|||
|
5 |
4.5 |
0.5 |
5.0 |
||||
|
32° C |
6 |
2.0 |
1.0 |
3.0 |
|||
|
7 |
4.5 |
0.5 |
5.0 |
||||
|
48° C |
8 |
2.0 |
1.0 |
3.0 |
|||
|
9 |
4.5 |
0.5 |
5.0 |
||||
All solutions were
incubated at indicated temperatures for 15 minutes before mixing each set of
tubes, temperature equilibrium was reached before mixing. The room temperature
test was done first in the same procedure as the first trial. Then the other
temperature test tubes were tested in the same way.
Next, the affects
of pH on enzyme activity were tested. Nine test tubes were numbered 1 through 9
and each filled with the correct reagents and amounts as listed in Table 3.
Table 3: Amounts of reagents to add for pH experiment (all values
in milliliters)
|
pH |
Tube |
Buffer |
H2O2
|
Peroxidase extract |
Guiacol (dye) |
Total Volume |
|
5 |
1 |
5 |
2 |
0 |
1 |
8 |
|
3 |
2 |
2 |
1 |
3 |
||
|
3 |
4.5 |
0.5 |
5 |
|||
|
5 |
4 |
2 |
1 |
3 |
||
|
5 |
4.5 |
0.5 |
5 |
|||
|
7 |
6 |
2 |
1 |
3 |
||
|
7 |
4.5 |
0.5 |
5 |
|||
|
9 |
8 |
2 |
1 |
3 |
||
|
9 |
4.5 |
0.5 |
5 |
The spectrophotometer was zeroed with the contents of test tube
1. Then the pairs of tubes were mixed
one at a time and the absorbance changes were measured as in the previous
experiments (20-second intervals for two minutes).
Next the affect of
boiling on peroxidase activity was tested. 3 mL of extract was added to a test
tube and placed into a boiling water bath for five minutes. While it was
heating, three other test tubes were numbered and had the reagents called for
in Table 4 added to them (except for the boiling extract).
Table 4: Amounts of reagents to add for boiling extract experiment
(all values in mL)
|
Tube |
Buffer (pH 5) |
H2O2
|
Boiled Extract |
Guaiacol (dye) |
Total Volume |
|
|
1 (control |
5 |
2 |
1 |
8 |
||
|
Set 1 |
2 |
2 |
1 |
3 |
||
|
3 |
4 |
1 |
5 |
After five minutes the test tube in boiling water was removed. It
was allowed to cool for 10 minutes in a water bath at room temperature; then it
was added to test tube 3. The contents of test tube 1 were used to blank the
spectrophotometer. Then the contents of test tube 2 and 3 were mixed. The
mixture was poured into a cuvette, and the absorbance was read at 20-second
intervals for two minutes.
Results:
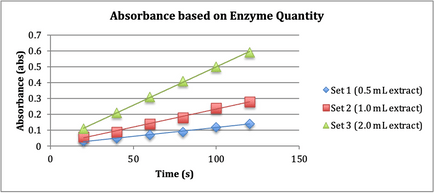
The results of the first test, in which enzyme
activity was measured for varying amounts of peroxidase extract, are noted in
Figure 1, “Absorbance based on Enzyme Quantity”.
Fig. 1. Three sets of solution containing
buffer (pH 5), H2O2, guaiacol (dye), and various amounts
of peroxidase enzyme extract (amounts are depicted in the legend) were employed
to test the way in which the quantity of enzyme present affects enzymatic
activity.
The rate of reaction increased fairly linearly
with increase in enzyme. Because Set 1 had the most linear increase in absorbance,
0.5 mL of extract was used for the rest of the experiments.
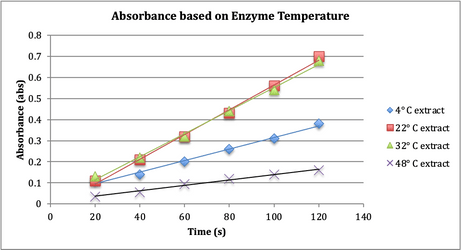
The
results of the second test, in which temperature’s affect on the activity of
0.5 mL of enzyme extract was tested, are recorded in Figure 2, “Absorbance
based on Enzyme Temperature”.
Fig. 2. Four sets of solution containing buffer
(pH 5), H2O2, guaiacol (dye), and peroxidase enzyme
extracts at varying temperatures (temperatures noted in legend on figure) were
employed to determine the affect of temperature on enzyme activity.
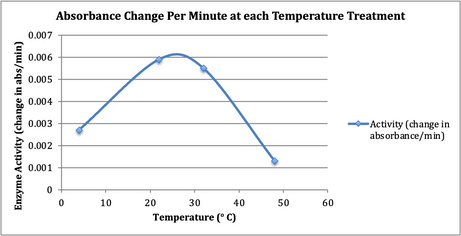
Figure 3 clearly
indicates the relationship between temperature and enzymatic activity.
Fig. 3. The top of the curve indicates the
optimum temperature at which the maximum rate of reaction is observed.
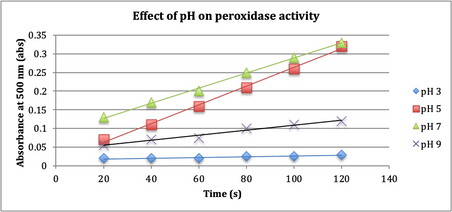
The next
experiment tested the affect of pH on peroxidase activity, the results are noted
in Figure 4, “Effect of pH on peroxidase activity”.
Fig. 4. Four sets of solution at room
temperature (22° C), containing H2O2, guaiacol (dye), and
peroxidase enzyme extract with 4 different pH buffers were employed to evaluate
the relationship between pH and enzyme activity.
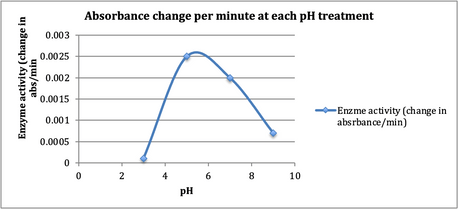
Figure 5 clearly shows the relationship between pH and enzyme activity
Fig. 5. The optimum pH is indicated by the peak
of the curve
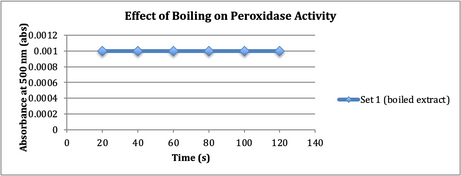
Finally
the affect of boiling on peroxidase activity was
tested. The results are in Figure 6.
Fig. 6. pH 5 buffer, H2O2,
boiled peroxidase extract, and guaiacol (dye) were added to make a solution,
which was then put into a spectrophotometer to observe the affect boiling had
on enzyme activity.
Discussion:
The first null
hypothesis tested was: the amount of
enzyme added to the reaction will have no affect on the rate of reaction.
Based on the results of the first trial in Fig. 1 regarding the rate of
reaction and amount of enzyme, the null hypothesis proposed is incorrect
because the amount of enzyme affected the rate of reaction.
In the second
experiment, which tested the correlation between enzyme activity and
temperature, the null hypothesis stated was that the temperature of a solution does not influence enzyme activity.
The results of the test (depicted in Figure 2) evidence the conclusion that
temperature does influence enzyme activity, and that there is an optimum
temperature that is most conducive to enzyme activity. For peroxidase, that
ideal temperature is between 22-32° C. The nearly freezing 4° C extract showed
less activity than the 22 and 32° C solutions, and the very hot 48° C solution
showed even less activity than the cold extract.
The next
experiment tested the relationship between pH of the reaction buffer to the
enzyme activity. The null hypothesis was the
pH of a solution does not affect the activity of an enzyme. The results
depicted in Fig. 4 evidence that enzyme activity does vary with pH, going
against the null hypothesis. The optimum pH for the peroxidase reaction seems
to be just greater than pH 5 according to Fig. 5’s bell curve.
Finally, the affect
boiling has on peroxidase activity was tested. Despite the tendency for
proteins to denature when they are heated to more than 70° C (Dolphin WD,
2005), the following null hypothesis was proposed: boiling an enzyme does not affect its activity. There was no
activity observed in the boiled extract, unlike the peroxidase at room
temperature, which was very active. This goes against the proposed null
hypothesis because the boiled peroxidase was not at all active.
Literature
Cited:
Campbell, N.A., Reece, J. B., Urry, L. A., Cain, M. L., Wasserman,
S. A., Minorsky, P.V., and Jackson, R. B., 2011. Campbell biology, Pearson
Education Inc., San Francisco, CA, 155-156 p.
Dolphin WD. 2005. Biological Investigations: form, function,
diversity and process. 7th ed. New York: McGraw-Hill Company. 482 p.
